
Historically, we didn’t use Androids profiling tools often. They were pretty awful and the only tools that we really
used extensively were the on-device GPU profiling tools which were reasonably good. In recent years Android’s
native story improved by leaps and bounds with the introduction of Android Studio and 3rd party tools developing
native Android apps has improved a lot. But the CPU profiling tools are still stuck in the stone age and this is
in stark contrast to the iOS tooling.
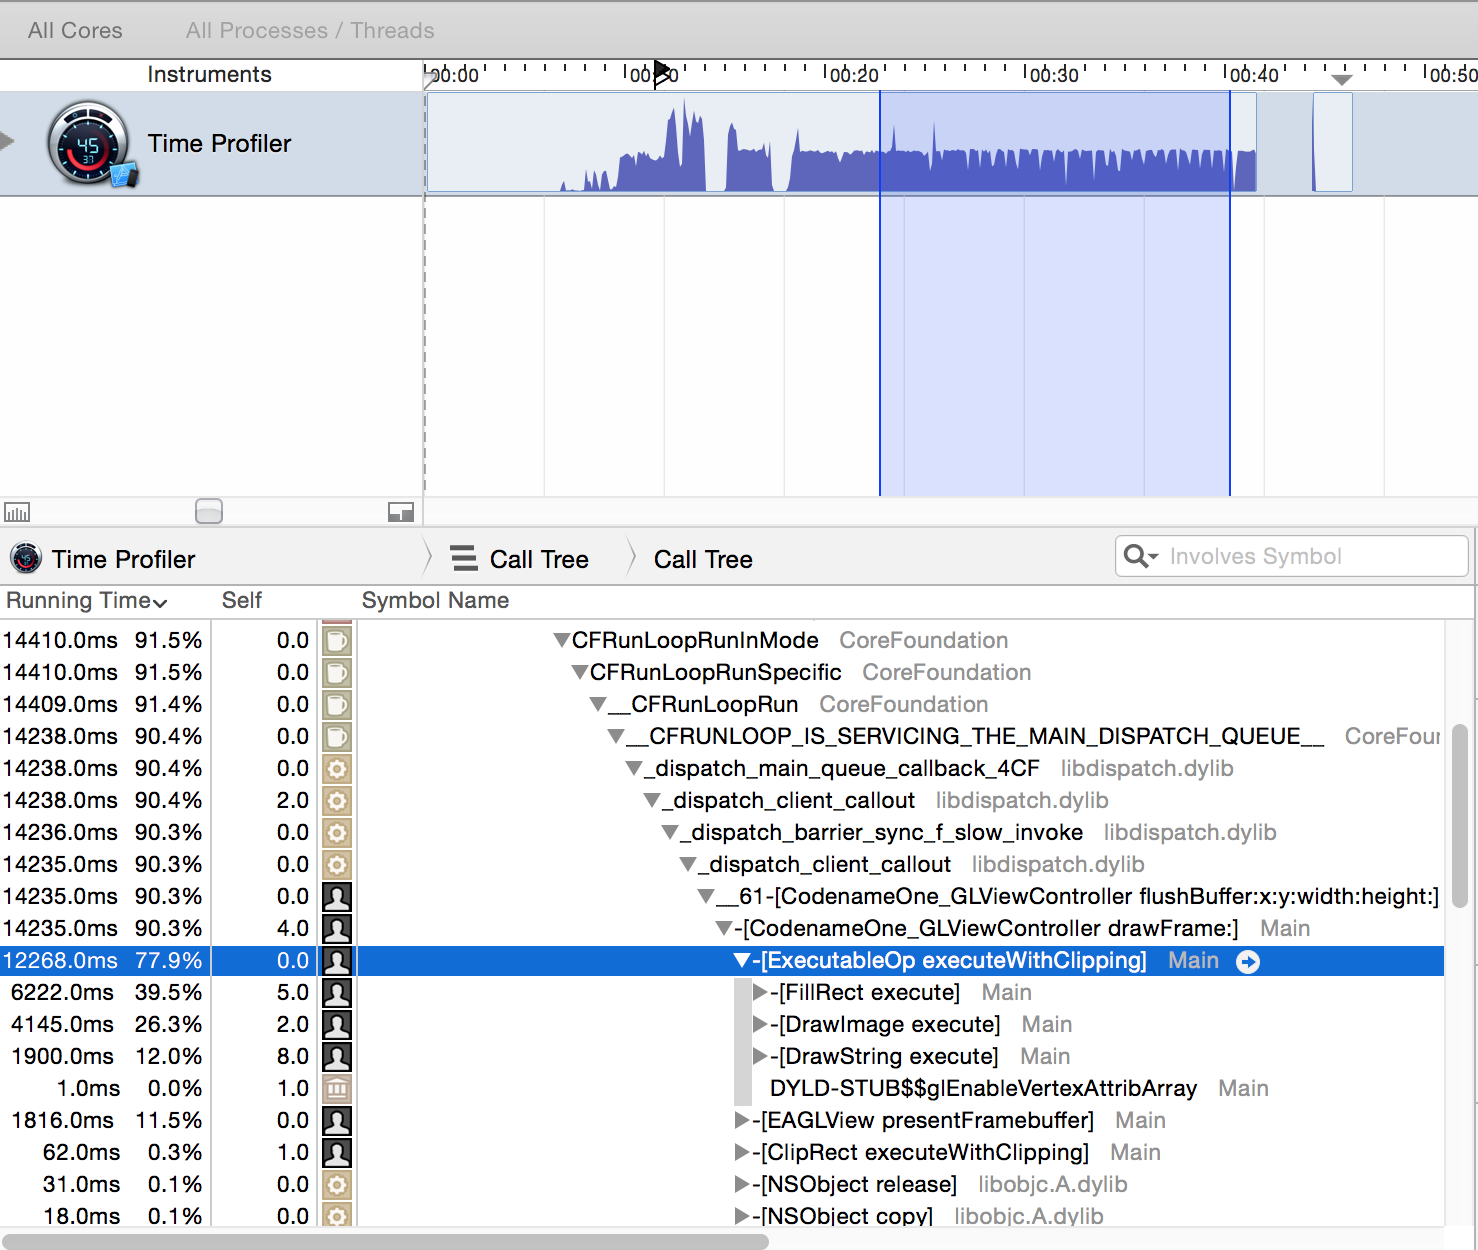
iOS Profiler
Better looking and more functional
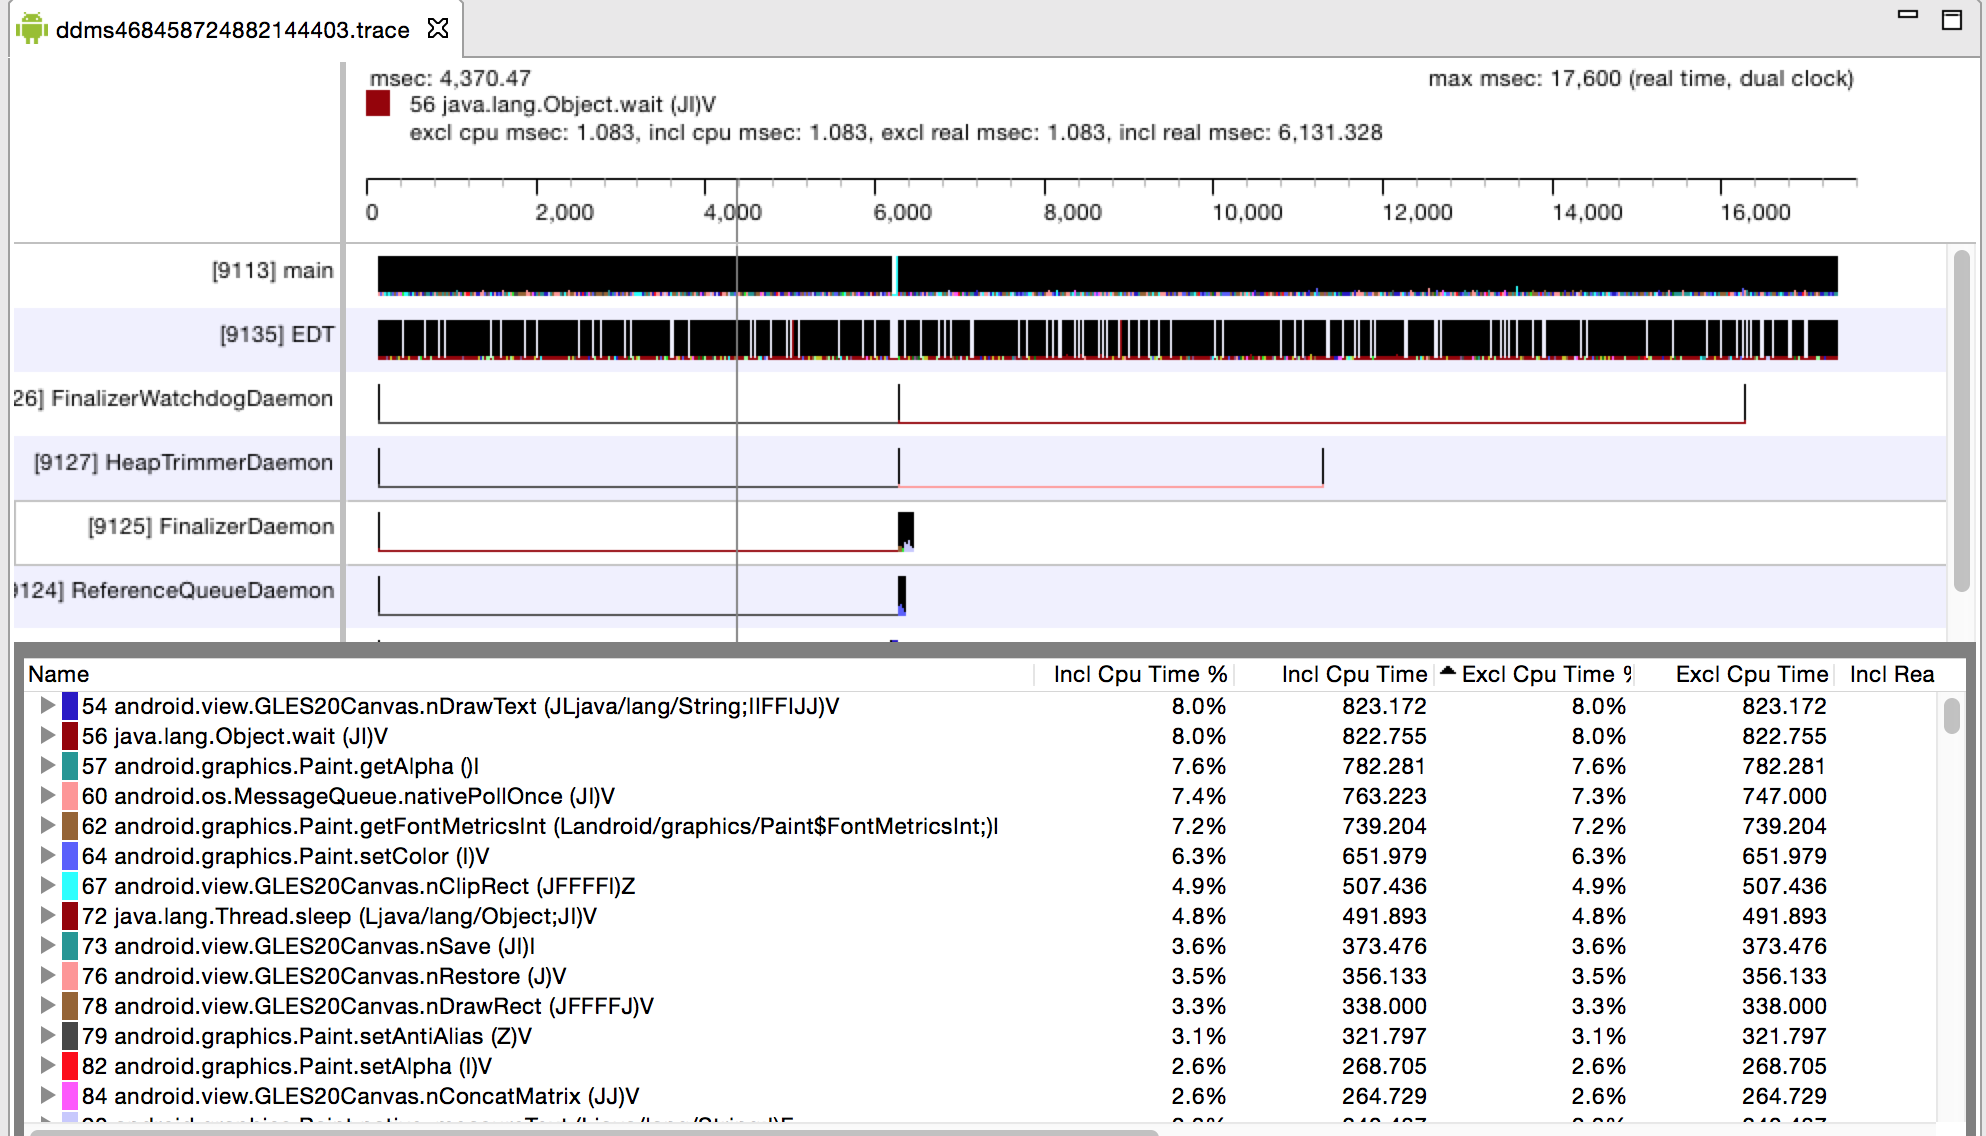
Android Profiler
Both unattractive and disfunctional
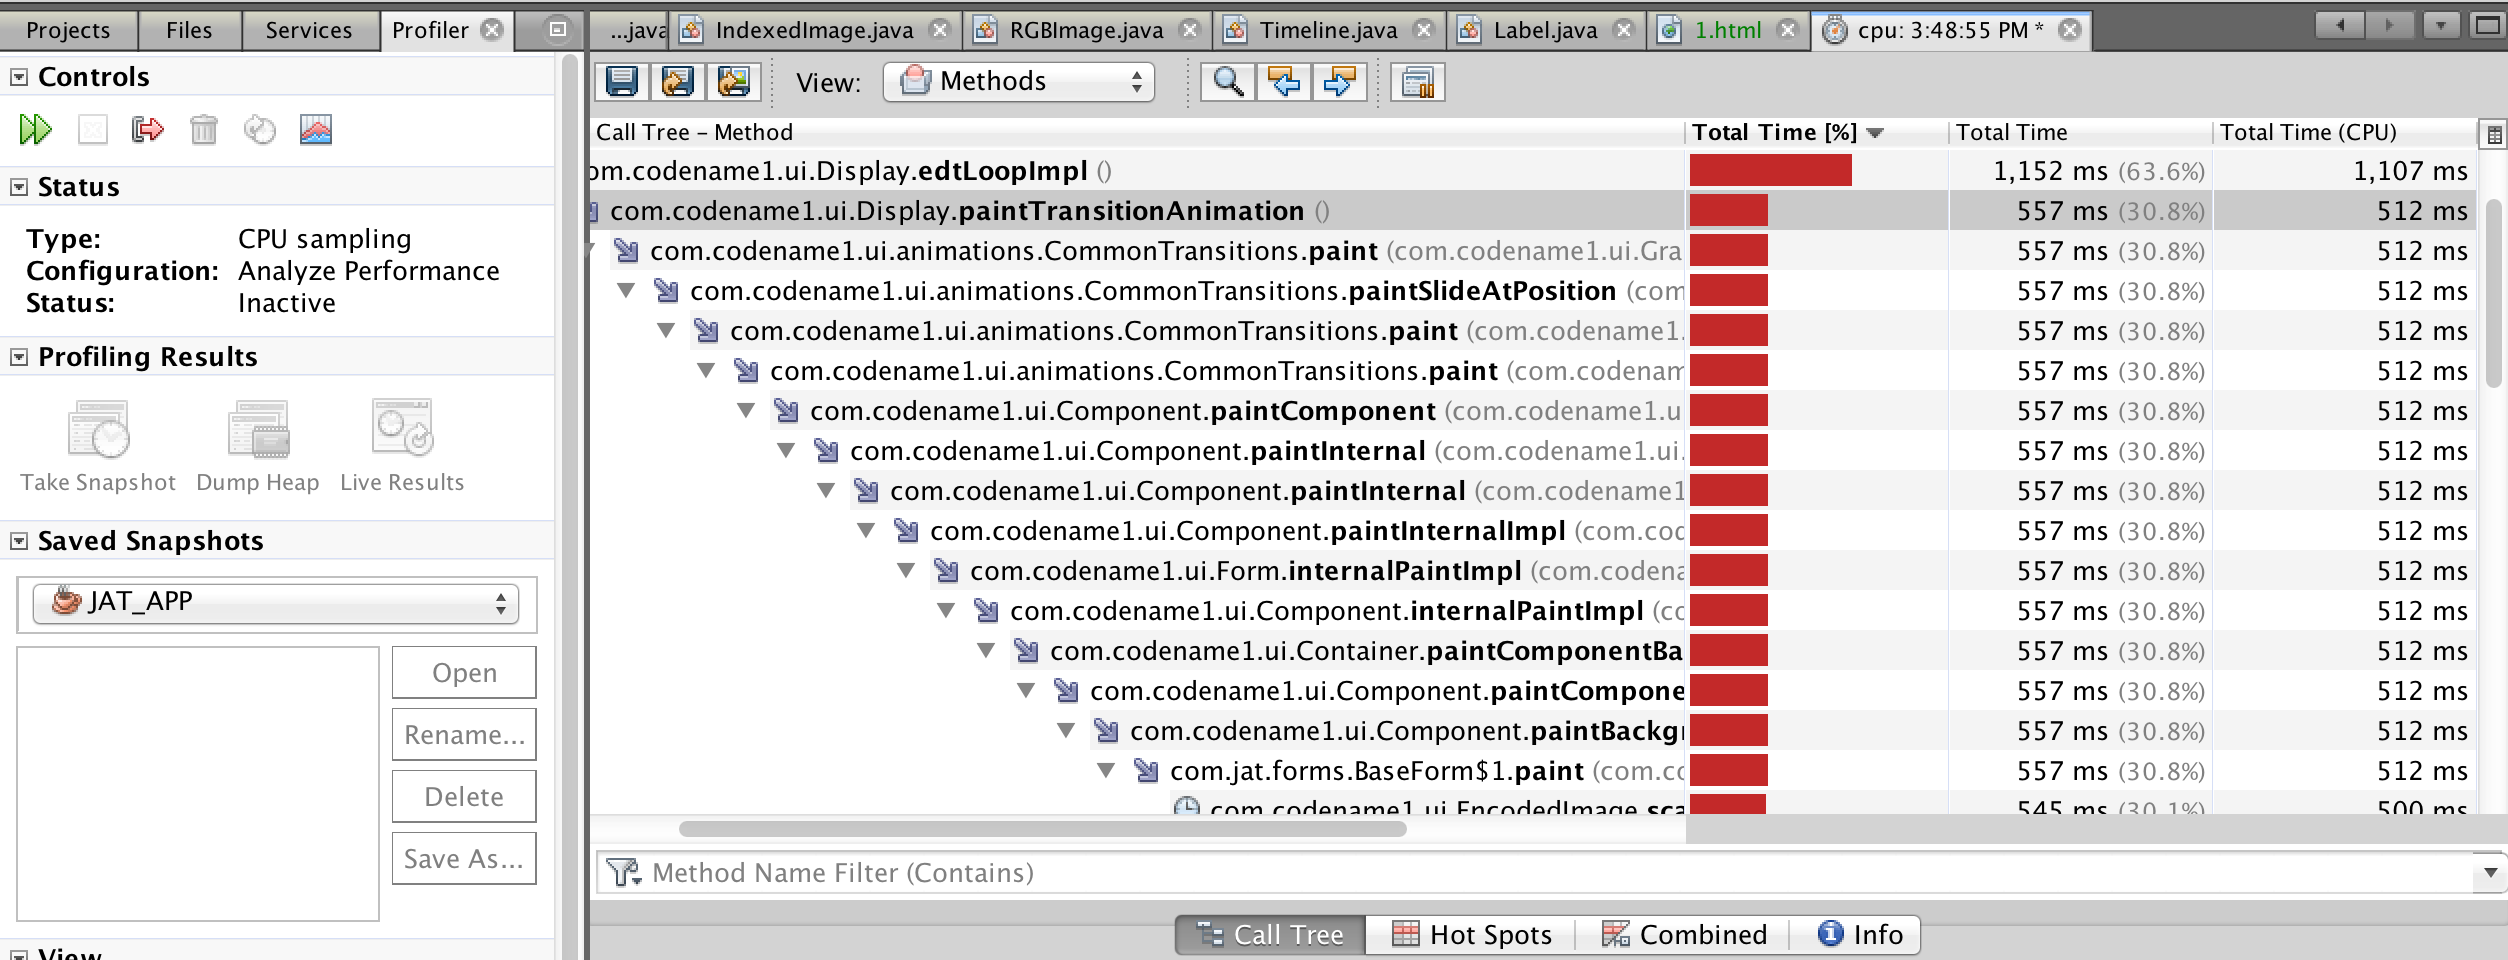
NetBeans Profiler
Java Profiles can be great e.g. NetBeans
The really painful aspect here is that Java has amazing profilers, we use them for Codename One on the desktop
and they deliver! E.g. check out the great NetBeans profiler pictured above.
The most depressing thing about this as an ex-Sun Java guy is that Apple implemented its amazing profiler using
D-trace!
For the uninitiated D-trace is a technology developed by Sun for instrumenting OS processes without overhead.
It works amazingly well and has no noticeable performance penalty while providing amazing insight into running
native/Java applications. If only Google/Oracle could patch things up maybe Android would be able to use something
like that and some of the standard desktop profiling tools.
One of the things I learned over the years from profiling on all of these platforms is that performance is very
portable. We use the NetBeans profiler 99% of the time and even when a problem isn’t felt on the desktop
it can be seen in the profiler. There are special cases such as gradients being slower on Android than they
are on the desktop, but overall performance is just 99% caching and eliminating calls. Just find the code that
happens a lot and make it happen less frequently.
On The Subject of Performance
Christmas is the time for deploying risky changes?
Well, that’s how we see it. Most of you guys will be on vacation and we’ll deploy some performance tuning
updates to squeeze additional smoothness out of Codename One. There were many things we discovered and
improved during our latest bout of profiling and I think we have the performance at a much nicer level than
it was a couple of weeks ago.
There are many changes to the handling of images, labels, fonts and more but most of them should be
completely seamless to all of you. Your app should just “feel smoother” with literally no code changes.
However, there are some tips and behaviors that you guys need to be aware of…
Component Paint Override
When overriding paint within Component we could sometimes rely on the color or other Graphics object
settings being consistent between device and simulator. The new Android pipeline shifts some logic into
the native rendering thread which means that code like this might behave oddly:
Label l = new Label("Label") {
    public void paint(Graphics g) {
        super.paint(g);
        g.drawLine(getX(), getY(), getX() + getWidth(), getY() + getHeight());
    }
};
Prior to this change “Label” and the line that would have been drawn on top of it would have been in the same
color. With this change the paint code might occur on the Android native layer and so the color of the graphics
might not be set when we reach the drawLine method call. This is a bug in the code above that
should never assume the color of the graphics context in advance.
Easier Optimizations
We always said that you should use images wherever possible, they are very performant but I’d like to refine
some of those cases. A lot of our optimizations both on iOS and Android revolved around moving the Label
drawing into the native layer, so drawing a label should be really fast…
But there are some edge cases that we just can’t handle in the native layer, e.g. if the icon for the label isn’t
a native image then we need to fallback to the slightly slower rendering code. So if you used:
Timeline (gif animation), FontImage, IndexedImage or
RGBImage your performance won’t be as great.
You don’t need to discard code that uses any of those but if you want to create a list with thousands of components
you might want to avoid them within that list. The latter 3 also provide a way to convert them into a regular image,
this allows you to still use something useful like FontImage or RGBImage without
the performance penalty in a large list.
If you don’t need the “ends with 3 points” functionality I would highly recommend you disable it. In large lists
it effectively initiates some string operations in some of the most performance crucial areas of the code.
You can disable this globally using the theme constant endsWith3PointsBool=false, as part of
this change we changed the default to false.